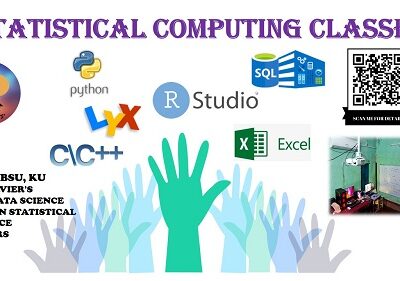


Course Description: Data Science with Python, R, SQL, and Excel
This comprehensive Data Science course is designed to equip learners with the essential tools and techniques for analyzing, visualizing, and extracting insights from data. Combining foundational concepts with practical skills, the course introduces Python and R programming for data manipulation, statistical analysis, and machine learning. SQL is covered to manage and query databases effectively, while Excel is utilized for quick data visualization and analysis tasks.
Whether you are a beginner or looking to advance your skills, this course provides hands-on experience with real-world datasets, enabling you to solve complex problems across various industries.
What You Will Learn
Module 1: Introduction to Data Science
- Overview of Data Science and its applications in various industries
- Data lifecycle and workflows
Module 2: Python for Data Science
- Data manipulation with Pandas and NumPy
- Data visualization with Matplotlib and Seaborn
- Introduction to Machine Learning libraries (e.g., Scikit-learn)
Module 3: R Programming for Statistical Analysis
- Basics of R and its IDE (RStudio)
- Data wrangling with dplyr and tidyr
- Advanced statistical modeling and visualization with ggplot2
Module 4: SQL for Data Management
- SQL fundamentals: SELECT, JOIN, GROUP BY, and aggregate functions
- Database design and management concepts
- Writing complex queries for data extraction
Module 5: Excel for Data Analysis
- Functions and formulas for data cleaning and analysis
- Pivot tables and charts for data visualization
- Using Excel as a tool for quick exploratory data analysis
Module 6: Capstone Project
- Integrating Python, R, SQL, and Excel to solve a real-world problem
- Presenting insights and solutions with data-driven storytelling
Learning Outcomes
By the end of the course, you will:
- Understand the fundamental concepts and applications of Data Science.
- Gain proficiency in Python and R for data analysis and machine learning.
- Efficiently manage and query databases using SQL.
- Use Excel for data cleaning, visualization, and basic analysis.
- Build end-to-end data solutions, from data extraction to visualization and interpretation.
- Be prepared for roles such as Data Analyst, Business Analyst, or Junior Data Scientist.
Take your first step into the exciting world of Data Science today!
Course Features
- Lecture 0
- Quiz 0
- Duration 54 hours
- Skill level All levels
- Language English
- Students 28
- Assessments Yes